ShopDreamUp AI ArtDreamUp
Deviation Actions


![Omnimo 6.0 for Rainmeter [Outdated]](https://images-wixmp-ed30a86b8c4ca887773594c2.wixmp.com/i/9a1e44ad-d8a6-484b-91a3-ccc9c064e06b/d6qp7f8-e6aa9d58-004a-4f90-85fd-ba68007aaf90.jpg/v1/crop/w_184,h_184,x_0,y_23,scl_0.184,q_70,strp/omnimo_6_0_for_rainmeter__outdated__by_fediafedia_d6qp7f8-92s-2x.jpg)
![Omnimo 6.0 for Rainmeter [Outdated]](https://images-wixmp-ed30a86b8c4ca887773594c2.wixmp.com/i/9a1e44ad-d8a6-484b-91a3-ccc9c064e06b/d6qp7f8-e6aa9d58-004a-4f90-85fd-ba68007aaf90.jpg/v1/crop/w_92,h_92,x_0,y_12,scl_0.092,q_70,strp/omnimo_6_0_for_rainmeter__outdated__by_fediafedia_d6qp7f8-92s.jpg)


Description
UPDATE 3.0.1 - 2023-07-24:
Bug fix. CPU freq on CPUmem skin would move when scaled up. Now fixed.
UPDATE 3.0.0 - 2023-07-22:
I decided to update the major rev on this one because I have made a lot of changes. I'll list the changes first, then I'll lay out all the meters functions.
- Updated CPUmem to auto adjust up to 64 threads
- Changed all the deprecated PerfMon measure to use UsageMonitor. No more PerfMon plugin measures used.
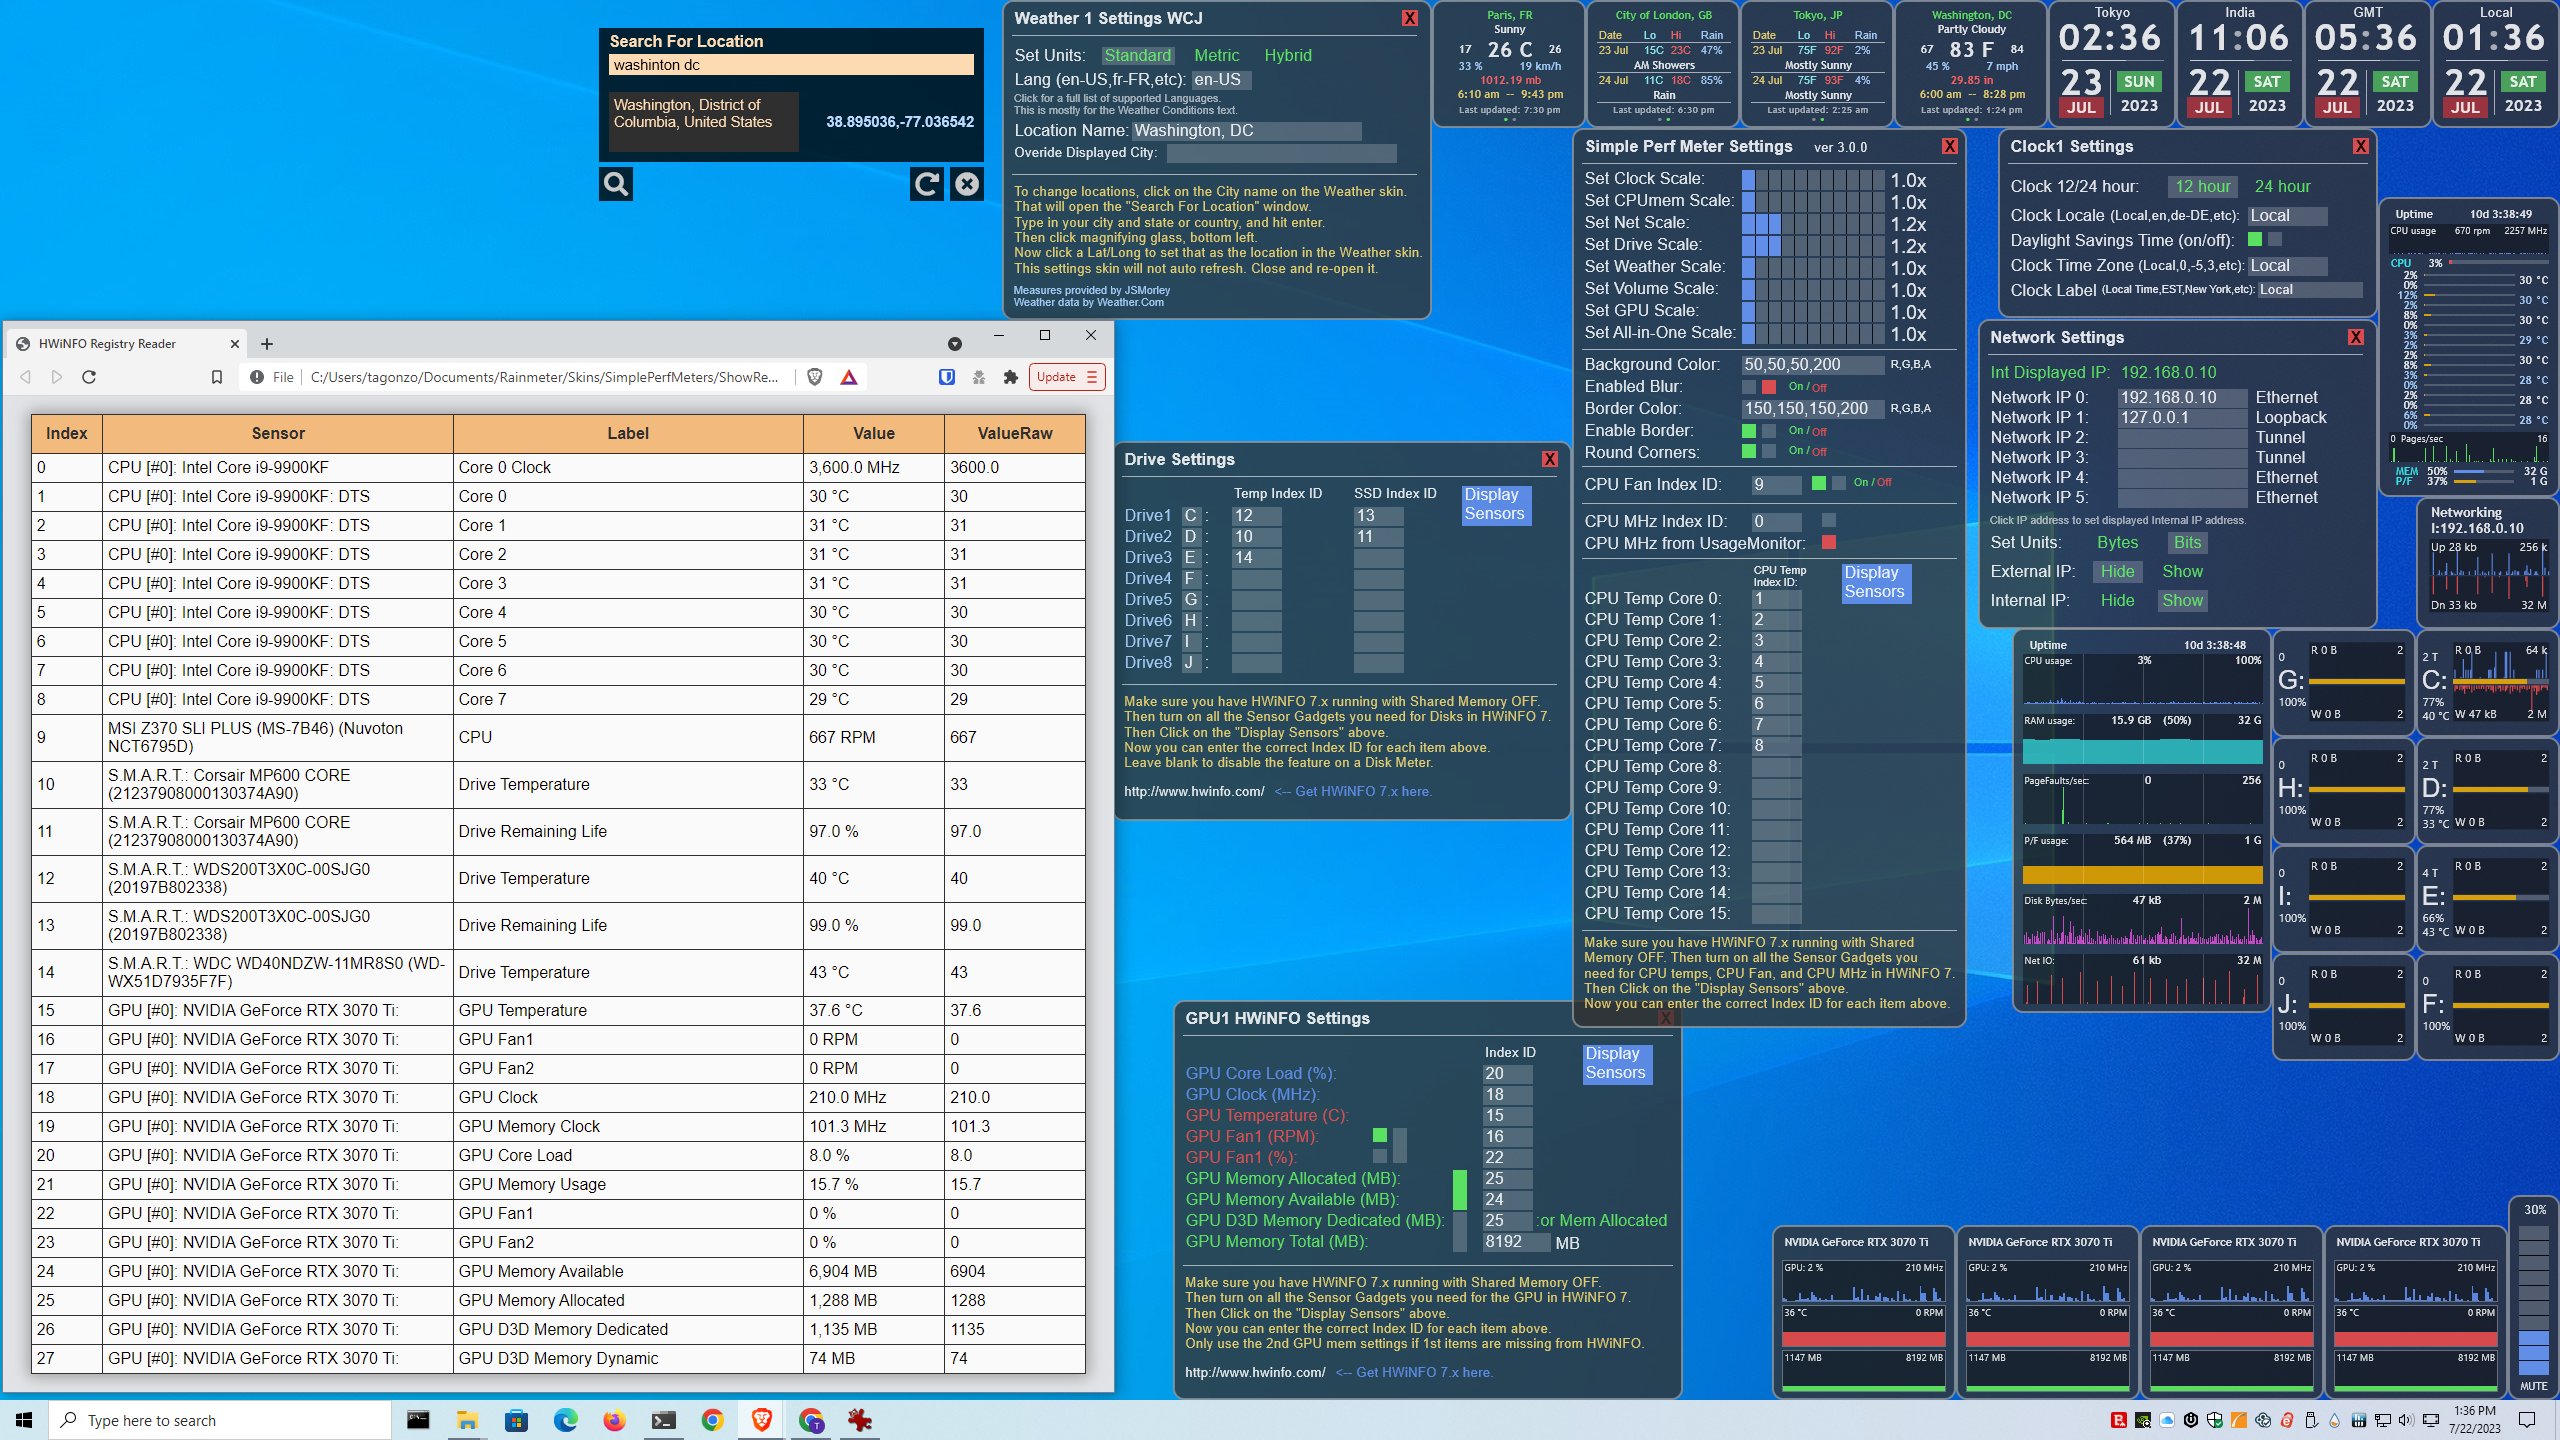
- Changed all of the HWiNFO plugin measures to use the non-plugin Registry method with HWiNFO 7.x. (thank you raiguard, JSMorley, SilverAzide, and others for the ShowReg script to display the sensor Indexes.
- Changed the Weather skins to use JSMorley's WeatherComJSON measures, and added up to 4 Weather skins, and added a two day forecast panel. There are several tooltips on these, so move your mouse around and see what is there.
- Added SSD life to the Drive meters. Requires HWiNFO.
- Added rounded corners, which you can turn on or off.
- Added a border line, which you can change the color and turn on or off.
- Added Blur option, can be turned on or off.
- Can now hide both External and Internal IP addresses.
- Lots of clean up and standardization in my coding. Not perfect, but way better.
To use the new HWiNFO 7.x sensors (without the plugin), you need to get and run HWiNFO 7.x and make sure the Shared Memory settings is OFF. Then you need to go into the Settings, then HWiNFO Gadget tab, and turn on (enable Report value in Gadget) for each sensor you will use. FYI, indexes may change value if you add more sensors later.
On CPU temperatures. With Intel making the latest processors with Performance cores and Efficiency cores, I know the Temperature sensors do not line up with cores exactly in my meters. I think the Performance Cores are actually 2 threads and have just one temp sensor per 2 core(or two threads). Where the Efficiency cores are not threaded and have one temp sensor per core. With many different models of this Processor having different P to E core layouts, I'm not sure how I want to tackle that problem. So the CPUmem skins stay the same as they were for now. You can always use the CPUmem skin with just one temp sensor and use the HWiNFO sensor that represents the whole CPU.
----------------------------------------------------------------------
These are Simple Performance monitoring meters (and a couple of extras) that I wanted for my own use. They are simple looking but provide enough information so I can see if my system is running normally. This became way bigger that I thought it would, but they are all useful. I'll fix any bugs as best I can, and I am trying to slow down on changes to this skin.
There are several clickable locations on the meters. Clicking on any Histogram will start up the Performance Resource monitor. The idea is, you see a meter with high activity, click it to get quick access to the Resource monitor so you can investigate why it is happening.
There are 4 variants of the CPUmem Meter. The original no Temps, and 3 with Temp versions.
CPUmem.ini - the original meter with no Temps, no CPU fan.
CPUmemTemp1.ini - only displays 1 Temp, if you don't want to see every core. CPU fan rpm. Requires HWiNFO.
CPUmemTemp1nocores.ini - only displays 1 Temp, and no individual cores, only the Average CPU usage.
CPUmemTemp1to1.ini - This is more for AMD processors that have 1 core per Temp sensor. CPU fan rpm. Requires HWiNFO.
CPUmemTemp2to1.ini - This is for most Intel processors that have 2 threads per Temp sensor. CPU fan rpm. Requires HWiNFO.
All-in-One meter. I added this mostly for troubleshooting to save 4 minutes of data while I am using full screen programs. Some may choose to use this instead of some of the other meters. I only run this one when I want to see the last 4 minutes of data all in sync. There are 1 minute time lines to help show when the data spike occurred.
GPU meter added. Requires HWiNFO 7.x to be running, and sensors to be enabled for the GPU. Use the GPU settings to fill in the appropriate Indexes to get it working. Not all GPU drivers have all of the settings. So you will need to look at the Display Sensors button and find what you have available and fill them in. Integrated GPUs do not always have all the fields needed.
I did my best to make Settings skins so you would not have to edit any settings files by hand. You can still do that if you like, but the Settings skins should be enough to make it all work.
Any issues getting HWiNFO to run on your system, please visit the HWiNFO site and check their forums for help. www.hwinfo.com/
All in One
Simple Perf Meter Settings
Network Meter
Network Settings
Disk Meter
Disk Settings
Clock Meter
Clock Settings
Volume Meter
Weather Meter
Weather Meter Forecast
Weather Meter Location Selector
Weather Meter Settings
On all Histogram meters, the number on the left is the current sample and the number on the right is the scale of the Histogram.
Internal IP address. It seems the plugin that gets the Internal IP address works well most of the time. If it does not, you can choose the IP from a list that your system currently has configured in the Network Settings.
Background color. I set the default to black and is mostly transparent. (50,50,50,200) That way some color from your wallpaper would show through. If you have a very light or very dark wallpaper, and want a more solid color similar to the blue in my cover image, try using 0,50,100,240. That works good with all the other colors I used in the skins.
FYI, I made these on my Windows 10 system, and have tested it on Windows 11. Should still work on Windows 7 for those couple of people still running it. Requires Rainmeter 4.2 or newer.
Enjoy.
Bug fix. CPU freq on CPUmem skin would move when scaled up. Now fixed.
UPDATE 3.0.0 - 2023-07-22:
I decided to update the major rev on this one because I have made a lot of changes. I'll list the changes first, then I'll lay out all the meters functions.
- Updated CPUmem to auto adjust up to 64 threads
- Changed all the deprecated PerfMon measure to use UsageMonitor. No more PerfMon plugin measures used.
- Changed all of the HWiNFO plugin measures to use the non-plugin Registry method with HWiNFO 7.x. (thank you raiguard, JSMorley, SilverAzide, and others for the ShowReg script to display the sensor Indexes.
- Changed the Weather skins to use JSMorley's WeatherComJSON measures, and added up to 4 Weather skins, and added a two day forecast panel. There are several tooltips on these, so move your mouse around and see what is there.
- Added SSD life to the Drive meters. Requires HWiNFO.
- Added rounded corners, which you can turn on or off.
- Added a border line, which you can change the color and turn on or off.
- Added Blur option, can be turned on or off.
- Can now hide both External and Internal IP addresses.
- Lots of clean up and standardization in my coding. Not perfect, but way better.
To use the new HWiNFO 7.x sensors (without the plugin), you need to get and run HWiNFO 7.x and make sure the Shared Memory settings is OFF. Then you need to go into the Settings, then HWiNFO Gadget tab, and turn on (enable Report value in Gadget) for each sensor you will use. FYI, indexes may change value if you add more sensors later.
On CPU temperatures. With Intel making the latest processors with Performance cores and Efficiency cores, I know the Temperature sensors do not line up with cores exactly in my meters. I think the Performance Cores are actually 2 threads and have just one temp sensor per 2 core(or two threads). Where the Efficiency cores are not threaded and have one temp sensor per core. With many different models of this Processor having different P to E core layouts, I'm not sure how I want to tackle that problem. So the CPUmem skins stay the same as they were for now. You can always use the CPUmem skin with just one temp sensor and use the HWiNFO sensor that represents the whole CPU.
----------------------------------------------------------------------
These are Simple Performance monitoring meters (and a couple of extras) that I wanted for my own use. They are simple looking but provide enough information so I can see if my system is running normally. This became way bigger that I thought it would, but they are all useful. I'll fix any bugs as best I can, and I am trying to slow down on changes to this skin.
There are several clickable locations on the meters. Clicking on any Histogram will start up the Performance Resource monitor. The idea is, you see a meter with high activity, click it to get quick access to the Resource monitor so you can investigate why it is happening.
There are 4 variants of the CPUmem Meter. The original no Temps, and 3 with Temp versions.
CPUmem.ini - the original meter with no Temps, no CPU fan.
CPUmemTemp1.ini - only displays 1 Temp, if you don't want to see every core. CPU fan rpm. Requires HWiNFO.
CPUmemTemp1nocores.ini - only displays 1 Temp, and no individual cores, only the Average CPU usage.
CPUmemTemp1to1.ini - This is more for AMD processors that have 1 core per Temp sensor. CPU fan rpm. Requires HWiNFO.
CPUmemTemp2to1.ini - This is for most Intel processors that have 2 threads per Temp sensor. CPU fan rpm. Requires HWiNFO.
All-in-One meter. I added this mostly for troubleshooting to save 4 minutes of data while I am using full screen programs. Some may choose to use this instead of some of the other meters. I only run this one when I want to see the last 4 minutes of data all in sync. There are 1 minute time lines to help show when the data spike occurred.
GPU meter added. Requires HWiNFO 7.x to be running, and sensors to be enabled for the GPU. Use the GPU settings to fill in the appropriate Indexes to get it working. Not all GPU drivers have all of the settings. So you will need to look at the Display Sensors button and find what you have available and fill them in. Integrated GPUs do not always have all the fields needed.
I did my best to make Settings skins so you would not have to edit any settings files by hand. You can still do that if you like, but the Settings skins should be enough to make it all work.
Any issues getting HWiNFO to run on your system, please visit the HWiNFO site and check their forums for help. www.hwinfo.com/
All in One
- click * in upper right corner to open the Settings to change scale of meters, now auto-hides
- All meters display 4 minutes of data, with 1 minute marker lines
- Uptime
- CPU Usage
- RAM usage
- PageFaults/sec
- PageFile usage
- Disk Bytes/sec (Read and Write combine), currently C: only
- Net IO (In and Out combine) Bits or Bytes follows the Network meter settings
- scalable size
- click * in upper right corner to open the Settings to change scale of meters
- Histogram of average CPU usage
- tooltip of CPU model when mouse over "CPU usage" string
- Bars of average CPU and per thread CPU usage
- CPU temperatures, 4 variants (no temps, only 1 core, 1 core per temp, 2 threads per temp) (req HWiNFO)
- CPU speed in MHz, choose from UsageMonitor or from HWiNFO
- ToolTip on CPU speed will display the Max speed of the CPU, which may not include the turbo or boost speeds
- CPU fan rpm, from HWiNFO, on variants with CPU temps
- click CPU/TASK to start the Task Manager
- click RAM/SYS to open the Control Panel -> System information page
- click P/F to open the window where you can change your Page File
- the CPU bar meters will automatically show only the number of CPUs you have up to 64 threads
- Memory size and usage, tooltip to show available mem
- Pages/sec is when memory allocation went to disk, which slows the system
- P/F Page File size and usage
- scalable size
Simple Perf Meter Settings
- click X in upper right corner to close
- click the bar to change the scaling factor from 1x to 2x in size
- set Background Color for all meters
- set Background Blur on or off
- Enable a Border on or off
- turn on Rounded Corners on or off
- CPU fan Sensor IDs from HWiNFO, with display on/off switch
- CPU Mhz Sensor IDs, choose from HWiNFO or from UsageMonitor, red block = selected
- Sensor ID input for the Temperature readings from HWiNFO, click on Display Sensor to see Indexes
Network Meter
- click * in upper right corner to open the Network Settings, use this if your Internal IP display is not correct
- click Ext IP address to open the Network and Sharing Center
- Network Upload/Download graphs in Bits or Bytes
- scalable size
Network Settings
- click X in upper right corner to open to close
- Can hide both External and Internal IP addresses. Nice when screen sharing.
- this will show up to 6 network interfaces and the IP address assigned to them
- click the IP address to set that as the displayed Internal IP
- Selectable Bits or Bytes
- click the Drive Letter to open a Windows Explorer to that drive, tooltip shows drive make/model
- click the drive size to open the Restore Point configuration, tooltip for SSD life here if configured
- click Percent Used number to open the Disk Cleanup utility to that drive, tooltip shows available space
- the Center Yellow bar is also space used
- Read/Write graphs in Bytes
- Drive temperature from HWiNFO, can be turned on/off in the Disk settings
- scalable size
Disk Settings
- click X in upper right corner to close
- Type in any drive letter for each of the 8 disks
- Enter the correct HWiNFO index for each drive Temperature and SSD life if available
Clock Meter
- click * in upper right corner to open the Clock Settings, auto-hides
- You can now have 4 clocks running in different TimeZones
- Time on top, with seconds as a thin bar just below the time
- click Time to open the Windows clock settings
- click Month to open a browser link to the current Month
- click Year to open a browser link to the current Year
- in 12 hour mode, the : will be bright for AM, and dim for PM
- added Locale for Month and Day of Week, change in settings, "Local" will use your Windows Locale
- scalable size
Clock Settings
- click X in upper right corner to close
- Up to 4 clocks can be displayed
- Each clock has it's own settings
- TimeZone is only set by number offset from GMT, 0, -5, -9, 5.5, etc (sorry, that is how Rainmeter allows this)
- If the TimeZone is set to Local, it will use your computers TimeZone and DST settings.
- Label is only displayed (at the top) if you type something, anything you like, city, timezone, etc.
- DST Daylight Savings Time on/off
- Select 12 hour or 24 hour
- Locale setting, Local, en-US, de-DE, fr-FR, it-IT, es-ES, etc. It changes the Month and Day of Week.
Volume Meter
- click the volume percent number at the top to open Windows sound settings
- click anywhere on the volume bar to set volume
- scroll wheel also changes volume
- click mute to toggle mute
- scalable size
Weather Meter
- click * in upper right corner to open the Weather Settings, auto-hides
- City, State or Country (click this to open the Location Selector)
- Current conditions, tooltip with longer conditions narrative
- Temps, forecasted Low, Current temp, forecasted High (click the current Temp to open Weather.com to configured City)
- Humidity and Wind
- Atmospheric Pressure
- Sun rise and Sun set
- Click 2 dots at bottom to change to the Forecast panel
- Up to 4 Weather meters
- data is from weather.com
- scalable size
Weather Meter Forecast
- click * in upper right corner to open the Weather Settings, auto-hides
- City, State or Country (click this to open the Location Selector)
- Date, Low temp, High temp, Rain chance
- Forecasted conditions, tooltip for a longer conditions narrative
- Click 2 dots at bottom to change back to Current Weather panel
Weather Meter Location Selector
- Provided by raiguard and JSMorley
- type in City State or County, hit enter
- click search magnifier at bottom
- click on the city name to open in google maps to verify location is what you want
- click Lat, Long to set as the Weather meter location
Weather Meter Settings
- Standard / Metric / Hybrid (mostly for the UK)
- Locale setting, en-US, de-DE, fr-FR, it-IT, es-ES, etc. It changes a couple of fields from the data stream.
- Location name from the Location Selector skin
- If the name is not what you would like from the Selector, you can override the displayed name
GPU Meter
GPU Settings
- Requires HWiNFO running
- Up to 4 GPU meters
- Display Graphics card model
- GPU load and graph, also has Core Clock speed
- GPU temperature and graph, also has Fan speed in rpm or % of operation
- Temp graph is 0-100 C
- GPU memory used and graph, and displays the total memory on the card
GPU Settings
- HWiNFO needs to be installed and running first
- click on the Display Sensors button to see the Indexes to use.
- Fill in the sensor Index information
- Pick if you want Fan rpm or % of Fan operation to be displayed, or turn it off
- If HWiNFO has the info needed for the 1st GPU memory data, use it before the 2nd method.
On all Histogram meters, the number on the left is the current sample and the number on the right is the scale of the Histogram.
Internal IP address. It seems the plugin that gets the Internal IP address works well most of the time. If it does not, you can choose the IP from a list that your system currently has configured in the Network Settings.
Background color. I set the default to black and is mostly transparent. (50,50,50,200) That way some color from your wallpaper would show through. If you have a very light or very dark wallpaper, and want a more solid color similar to the blue in my cover image, try using 0,50,100,240. That works good with all the other colors I used in the skins.
FYI, I made these on my Windows 10 system, and have tested it on Windows 11. Should still work on Windows 7 for those couple of people still running it. Requires Rainmeter 4.2 or newer.
Enjoy.
© 2015 - 2024 TGonZ0
Comments125
Join the community to add your comment. Already a deviant? Log In
Using AMD ryzen 7 7800x3D the CPU utilization doesnt work correctly. CPUmemTemp1 shows a max of 7% usage when task manager shows +90% usage. Using the other meters that show all cores everything is at 0-7% usage, except the last "core" goes up to 70-80%.